
Back in 1952, the economist William Vickrey proposed a fairly unique solution to New York City’s subway congestion problem: introduce a variable fare that fluctuated during peak times. The idea was that the market powers would help tackle the ever-longer commutes by introducing some simple supply-and-demand principles.
While Vickrey’s subway proposal didn’t gain a lot whole of steam, the congestion pricing concept quickly spread to the public roadways, and eventually became a mainstream economic idea. And in 1995, after technology had finally caught up with theory, California implemented the first such system on Interstate 15. This computer-controlled system of variable pricing has spread to highways across the world, and I’m sure is the exact prior art that IBM “inventors” Christopher James Dawson et al paid homage to when they “invented” and patented this exact system in 2008.
Braving a torrent of lawsuits from IBM’s intellectual property division, Georgia became yet another state to have variable toll rates. While Georgia’s system (Peach Pass) is a little late to the game, it does have the advantage of fifteen-plus solid years of technological advancement since 1995: the internet, high-speed image processing, commoditized hardware, etc.
In fact, it’s this very same stack of technology that allows Peach Pass to take its congestion pricing system into the modern age by allowing anyone with an Internet connection to see these real-time rates in real-time on their website. So given the wide array of readily available options from SOAP to JSON to EJB, what did Peach Pass opt for to displays these rates back to the website?
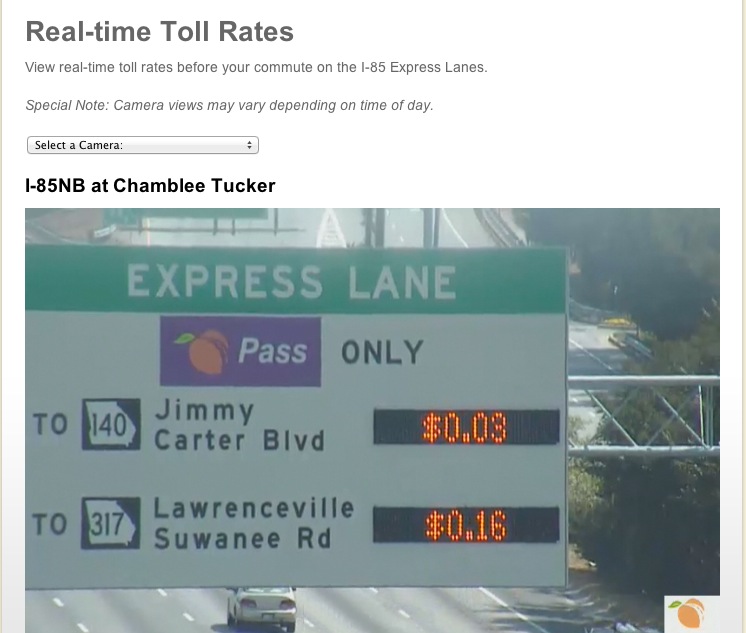
Yep, the classic IP/CAM-IP/SIGN Protocol: an IP-enabled Web Camera pointing at an IP-enabled Digital Sign. Or as some might call it, Peachy RealTime.
(Thanks to reader Karun R for the tip)