
The dependency graph of your application can provide a lot of insight into how objects call each other. In a well designed application, this is probably mostly acyclic and no one node on the graph has more than a handful of edges coming off of it. The kinds of applications we talk about here, on the other hand, we have a name for their graphs: the Enterprise Dependency and the Big Ball of Yarn.
Thomas K introduces us to an entirely new iteration: The Big Ball of Mandelbrot
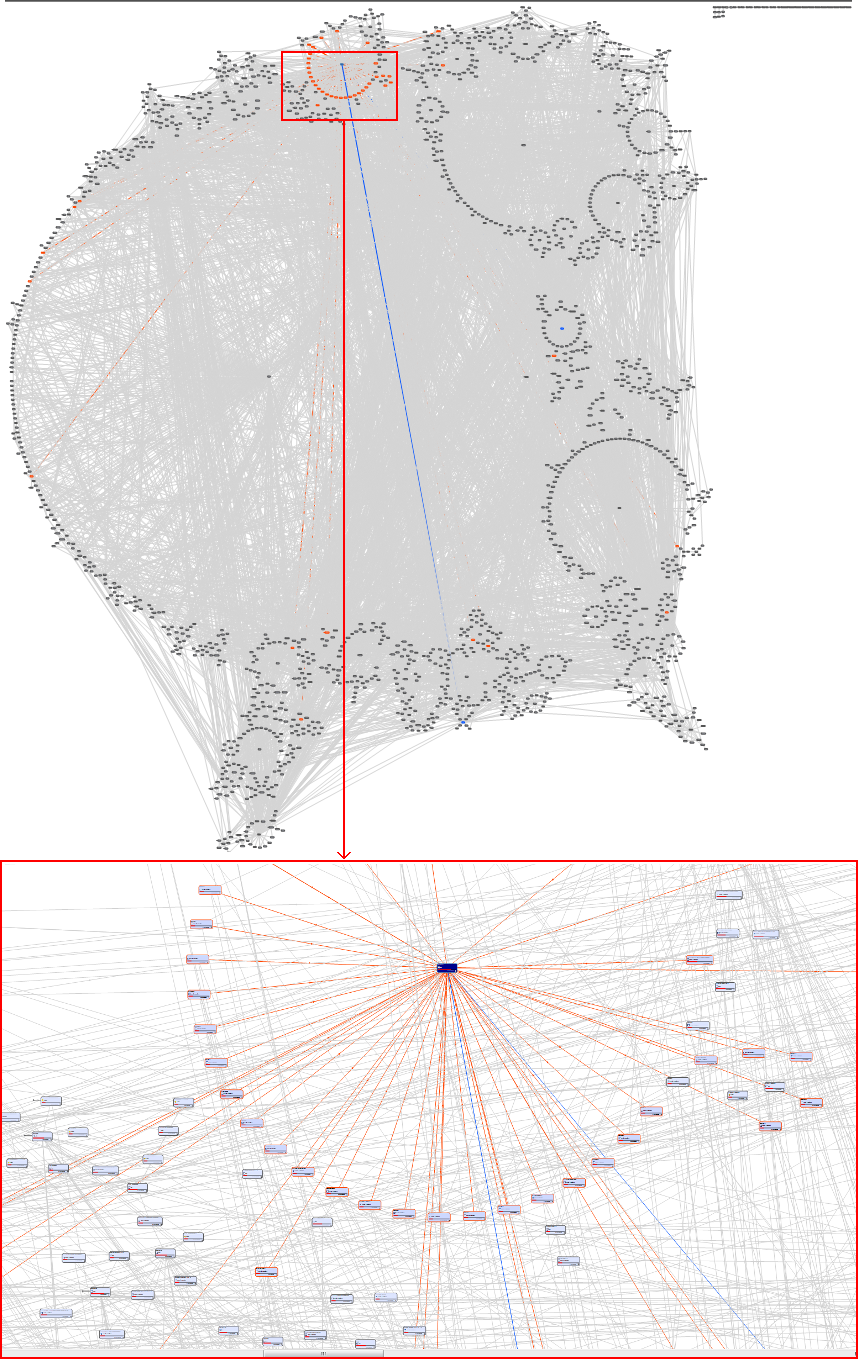
This gives new meaning to points “on a complex plane”.
What you’re seeing here is the relationship between stored procedures and tables. Circa 1995, when this application shambled into something resembling life, the thinking was, “If we put all the business logic in stored procedures, it’ll be easy to slap new GUIs on there as technology changes!”
Of course, the relationship between what the user sees on the screen and the underlying logic which drives that display means that as they changed the GUI, they also needed to change the database. Over the course of 15 years, the single cohesive data model ubercomplexificaticfied itself as each customer needed a unique GUI with a unique feature set which mandated unique tables and stored procedures.
By the time Thomas came along to start a pseudo-greenfield GUI in ASP.Net, the first and simplest feature he needed to implement involved calling a 3,000 line stored procedure which required over 100 parameters.